A network diagram, as defined by Wideman, is:
- A schematic display of the sequential and logical relationship of the activities which comprise the project. Two popular drawing conventions or notations for scheduling are arrow and precedence diagramming.
- A view of project data in which the project logic is the sole determinant of the placements of the activities in the drawing. Frequently called a flowchart, PERT chart, logic drawing or logic diagram.
- A graphic representation of activity sequence and relationships. Activity boxes are connected together with one-way arrows to indicate precedence. The first activity is placed on the left side of the diagram with the last activity on the right side. Activity boxes are usually placed at different levels (not in a single row) to accommodate activities that are done simultaneously.
Once we have the durations and logic of a project we can actually build a schedule. Here are the steps advised by Newell (p. 57):
- Create a list of activities that are to be scheduled
- Assign a duration to each of the activities
- Determine the predecessor for each activity
- Calculate the forward pass, the early schedule for each activity
- Calculate the backward pass, the late schedule for each activity
- Calculate the float for each activity
- Determine the critical path
- Determine if the predicted project completion is ealier than the promise date
- Adjust schedule or promise date
- Apply resources and determine resource constraints
- Adjust the schedule to allow for resource constraints
- Determine if the predicted completion is ealier than the promise date
- Adjust schedule or promise date
- Get approval on schedule.
Precedence Network Diagramming Method (PDM)
A network diagramming technique in which activities are represented by boxes (or nodes). Activities are linked by precedence relationships to show the sequence in which the activities are to be performed.

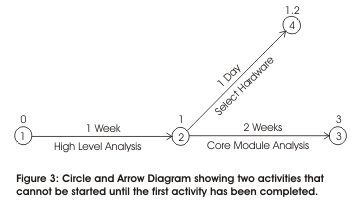
Arrow Diagramming Method (ADM)
A network diagramming technique in which activities are represented by arrows. The tail of the arrow represents the start and the head represents the finish of the activity (the length of the arrow does not represent the expected duration of the activity). Activities are connected at points called nodes (usually drawn as small circles) to illustrate the sequence in which the activities are expected to be performed:

Images taken from http://www.mindtools.com/pages/article/newPPM_04.htm
----- REFERENCES -----
Newell, M. W. (2002). Preparing for the Project Management Professional (PMP) Certification Exam. New York, NY: American Management Association.
Project Management Institute (2000). A Guide to the Project Managment Body of Knowledge. Newton Square, PA: Project Management Institute, Inc.